Display menu
The Display menu provides basic functions related to the screen behaviour and presentation of the echo data. Use the Display menu to control the visual aspects of the system, and to show or hide various elements in the presentation.
How to open
Select the Display icon.

The icon is located under the Main menu. Select the icon one more time to close the menu.
Description
Only brief descriptions are provided.
For detailed information about each function and dialog box, refer to the Reference Manual or the context sensitive on-line help.
If you do not need to use the menu system, you can hide it. This allows more space for the echo presentation.

Use the Menu on the top bar to hide or show the menu. When the menu system is hidden, it appears temporarily on the left or right-hand side of the screen if you move the cursor to that position.
The choices in this menu depends on which view in the display presentation that is currently "active". The menu may therefore change from one view to another. The screen capture may not show you all the menu choices.
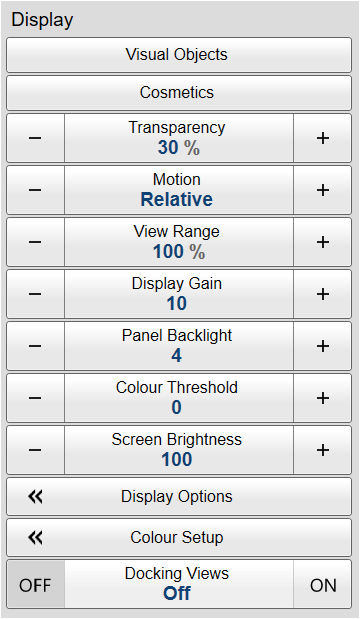
Functions and dialog boxes
- Visual Objects
Visual Objects is an "on/off" button used to open the Visual Objects menu. The Visual Objects menu controls which graphical elements that are shown in the different views. These graphic elements include markers, vectors and targets that are tracked. The majority of the functions are "on/off" buttons to enable or disable these graphic elements in the various views.
- Cosmetics
Use the functions on the Cosmetics menu to turn "cosmetic" elements in the sonar presentation on or off. The majority of the functions are on/off buttons to enable or disable "cosmetic" elements in the sonar views. This function is not available in all the views.
- Transparency
When you open an information pane, you will see that it is transparent. This transparency allows you to see the echo data behind the pane, but it may also reduce the visibility of the information in it. The transparency can be adjusted.
- Motion
In selected views you can control how the vessel symbol shall "behave" in the presentation. The way the vessel moves in the presentation can be chosen either true or relative.
- View Range
Use View Range to expand the range shown in the relevant views to any percentage of the original Range setting. This function can be used if you wish to move your ship symbol to the bottom of the view. You can then expand the range without adding zoom.
- Display Gain
Use Display Gain to increase or decrease the "strength" of the echo presentation.
- Panel Backlight
The buttons on the Operating Panel have a built-in backlight to improve visibility on a dark bridge. Use Panel Backlight to control the intensity of the lights.
- Colour Threshold
The Colour Threshold function allows you to reduce or increase the number of colours. This will provide a filtering effect that removes the weakest echoes.
- Screen Brightness
The intensity of the light given off by the display presentation can be adjusted. You can use this function to increase or decrease the light from the screen to match the ambient light.
- Display Options
The top bar gives you fast access to key functionality and navigational information. It provides buttons to hide or show the menu, to monitor data recording, to open the Messages dialog box, and to open the context sensitive on-line help. To choose which navigation elements to see on the top bar, use the functionality provided in the Display Options dialog box. It controls the location of the menu. You can also select which tooltips to appear when you move the cursor over the echo information. The dialog box is organised in pages grouping parameters for different parts of the application.
- Colour Setup
The Colour Setup dialog box controls the presentation colours used by the ST90 system. This includes the palette ("skin"), the number of colours in use, and the colour scale when no Time Variable Gain (TVG) setting has been selected for the presentation.
- Docking Views
Each presentation mode offered by the ST90 system provides a selection of views in a predefined pattern. These are placed at different positions with different sizes. With the Docking Views function you can move and re-size the views in the display presentation.
Once the Docking Views function is activated, the various views are placed in named windows, and docking positions for these windows are shown. The docking positions show you where to drag and drop the selected view. Any view can be selected, and then repositioned as indicated by the docking positions.