Echogram view
The Echogram view shows a time based history for a selected beam. Horizontal dotted lines show the depth intervals. The beam used to provide data is identified in the top left corner of the view.
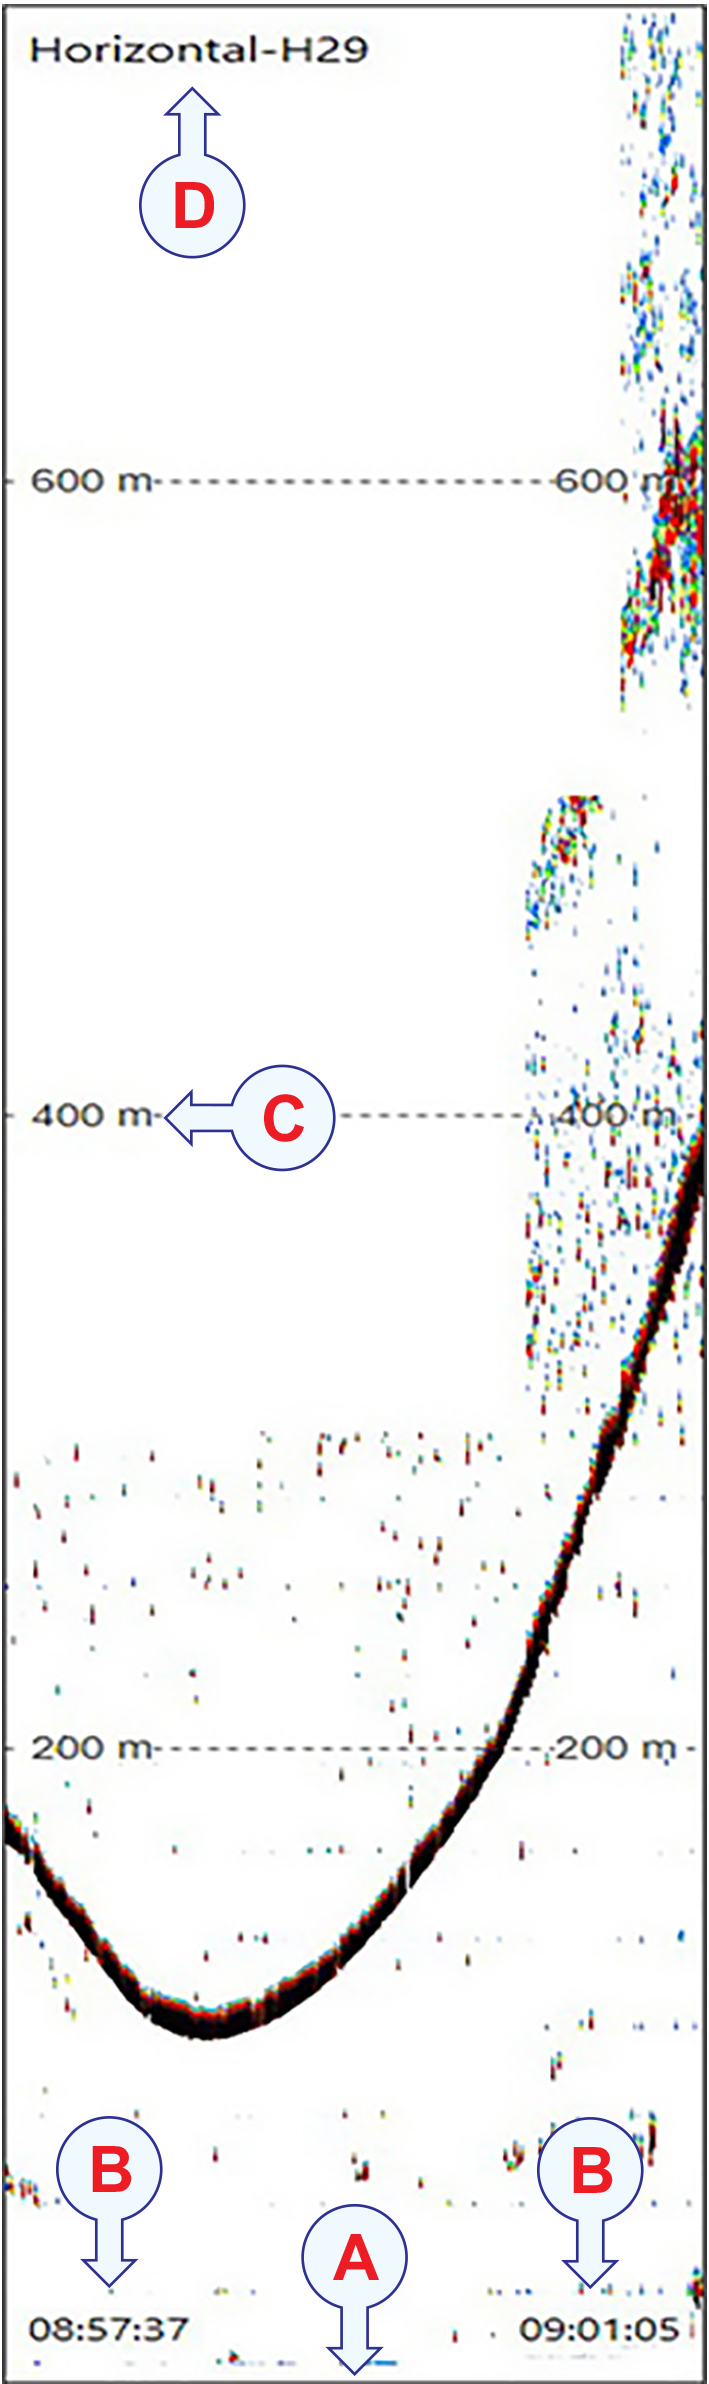
- This is the start of the echogram The distance from the lower part to the upper part of the view corresponds to the currently selected range.
- Small labels are shown in the bottom left and right corners of the view. These labels show you the time in order to identify the scale of the horizontal axis.
- Equidistant horizontal scale lines are drawn in the view to indicate the range. The Range setting defines how "far" you wish the ST90 system to detect echoes.
- The view is identified at the top of the presentation.
Description
At the bottom of the display presentation, select a suitable presentation mode, and activate the Echogram view.
Although the presentation of the echoes is most important in this view, it also contains a number of other objects. These provide you with additional functionality, as well as information that is useful or important while using the ST90 sonar system.
- Bearing
The echo data is taken from the current bearing and tilt. The bearing for the Echogram view is controlled by the bearing in the Horizontal view. The current bearing is shown with a solid line pointing out from the vessel position. You can change the angle by means of the Bearing function on the Main menu. You can also select the bearing line in a Horizontal view and drag it sideways.
- Tilt
The echo data is taken from the current bearing and tilt. The current tilt is shown with a solid line in the Vertical view.
You can change the tilt angle by means of the Tilt function on the Main menu. You can also click on the tilt line in a Vertical view and drag it up and down. If you place the cursor over the tilt presentation in the upper left corner of the Horizontal view you can use the scroll wheel to change the tilt.
- Range
The distance from the lower part to the upper part of the view corresponds to the currently selected range. The Range setting defines how "far" you wish the ST90 system to detect echoes. This function is opened from the Main menu.
Equidistant horizontal scale lines are drawn in the view to indicate the range.
- Horizontal Scroll
Small labels are shown in the bottom left and right corners of the view. These labels show you the time in order to identify the scale of the horizontal axis.
Use the Horizontal Scroll function to control how fast each echogram shall travel across the Inspection view. Select a numerical value to set the speed. The speed is controlled by adjusting the number of pixels used to present each ping. A higher speed will update the view faster, but will also reduce the resolution. You open this function from the Active menu.
- Identifier
The beam used to provide data is identified in the top left corner of the view.
- Tooltips
When you move the cursor over the echo data in the Echogram and Inspection views, small "tooltips" are shown to provide additional information. Several tooltips can be shown in the sonar presentation. When a tooltip is enabled, the cursor location is detected and a small information box is shown. By default, the information is related to the exact position of the cursor. The information provided for noise shows you the noise reading for the latest ping independent of the cursor’s location. Each tooltip represents a specific piece of information, and they are listed separately.
The Tooltip page offers a range of "on/off switches". Each tooltip is presented in the list, and you can enable or disable each of them independently. This page is located in the Display Options dialog box. The Display Options dialog box is located on the Display menu.
Before you can change the settings related to a view, the view must be active. To activate a view, click in it. The active view is identified with a thicker border.
To fully understand how the beams behave in this view, use the Beam Visualization dialog box.