B-Scan page
The B-Scan page allows you to monitor the data received from each of the elements in the transducer. The start sample and the number of samples to be displayed are selectable.
How to open
This page is located in the Element BITE dialog box. Open the Element BITE dialog box from the Processor page in the Diagnostics dialog box. Open the Diagnostics dialog box from the Setup menu.

Description
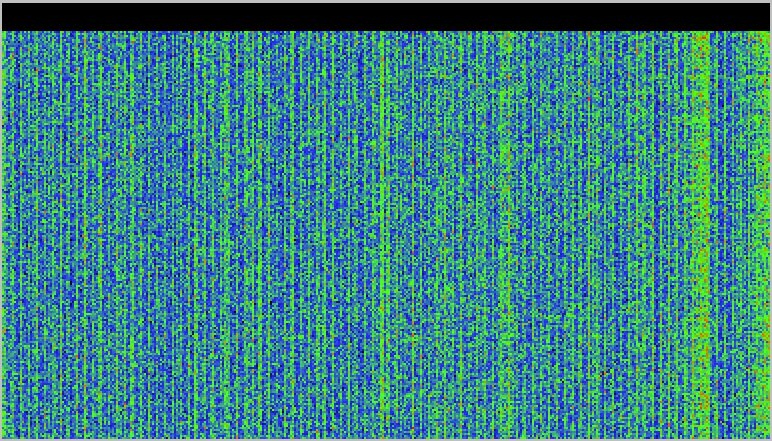
In the B-Scan presentation, each element in the transducer is shown as a long coloured vertical rectangle. If you place the cursor on top of one of these rectangles, a small yellow tool-tip will identify key information about the channel.
- The identification of the transducer element
- The identification of the transceiver board
- The current sample you are looking at
- The measured echo value (in dB)
To detect unserviceable transducer elements and/or transceiver boards, you must compare the rectangles. When operating the ST90 system in port, the colours will be less homogeneous due to the environmental noise and the shallow depth. During normal operation at sea the colours will be homogeneous.
If a single element is "dead" (no transmit, no receive), the rectangle is easily spotted because its colour is black.
If a single element is receiving, but not transmitting, the rectangle is normally presented in lighter shades of blue.
If a transceiver board is "dead" (no transmit, no receive), all the transducer elements connected to the board are easily spotted because they are all black.
Details
- Mode
Select the operating mode of the diagnostic system.
- Select None/freeze when you have received the data and wish to freeze the presentation for a closer study of the results.
- Select Element amplitude to start the test.
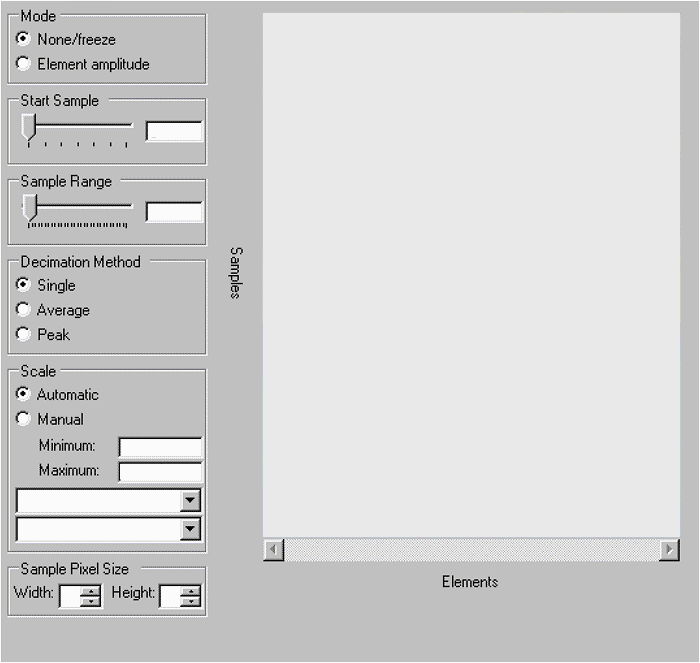
- Start Sample
Use Start Sample to select which sample to start the test with. Each vertical line shows the signal measured from a single transducer element. Sample 0 (zero) is measured when the ping starts, while (for example) sample 1000 is located several meters out. Use Start Sample and Sample Range to select which range to show in the B-Scan presentation.
- Sample Range
Use Sample Range to select how many samples you wish to include in the test. Each vertical line shows the signal measured from a single transducer element. Sample 0 (zero) is measured when the ping starts, while (for example) sample 1000 is located several meters out. Use Start Sample and Sample Range to select which range to show in the B-Scan presentation.
- Decimation Method
Sample range is normally selected so that there are no space to display all measurements in the dialog box. If you need to reduce the number of samples, you can select decimation methods Single, Average or Peak.
Single decimation method means that only the first sample is used, the rest are disregarded.
Average decimation method means that the average value of the samples is shown.
Peak decimation method means that the strongest sample value is shown.
- Scale
Choose the scale of the presentation.
- Sample Pixel Size
Use Sample Pixel Size to define the width and height of each individual sample in the presentation (in pixels).
- Text lines
Two text lines are provided under the graphic presentation.