Matrix page
The Matrix page allows you to monitor the average signal values or signal phases from each of the channels and transducer elements in the ST90 system. The presentation is provided on a matrix corresponding to the element locations in the transducer.
How to open
This page is located in the Element BITE dialog box. Open the Element BITE dialog box from the Processor page in the Diagnostics dialog box. Open the Diagnostics dialog box from the Setup menu.

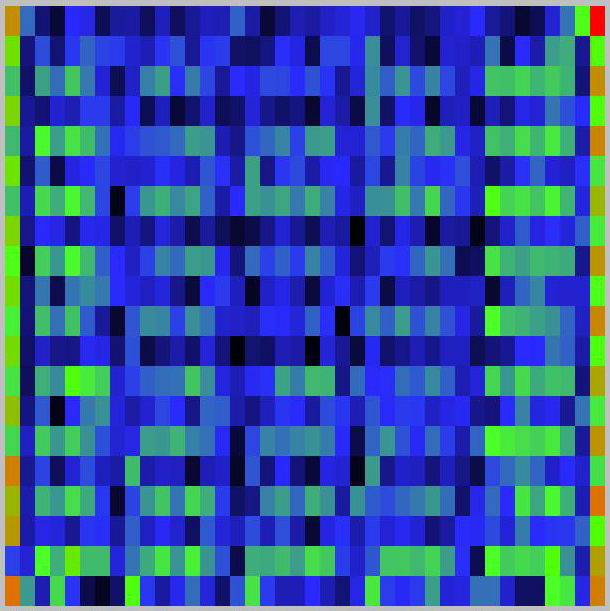
This illustration shows a typical matrix presentation. This is a generic illustration. Any similarities with specific products are accidental.
Description
When you move the cursor over the matrix presentation of the transceiver channels, each element in the transducer can be clearly identified as a rectangle. If you place the cursor on top of one of these rectangles, a small yellow tool-tip will identify key information. This function is designed to check the operation of the individual channels in the transceiver, as well as the elements in the transducer.
The identification of the transducer element
The identification of the transceiver board
The measured echo value (in dB)
A rectangle with 32 black elements in the matrix view indicates a failure with a single transceiver board. The tooltip will indicate which board that fails. Restarting the ST90 system will normally fix the problem.
Failure of a number of consecutive transceiver boards indicates a problem with the power supply.
Weak signals indicate a problem with the supply power to the analogue amplifiers.
No response indicate a problem with the supply power to the digital circuitry.
A failure in the high voltage power supply to the transmitter circuitry can only be detected in the transmit test.
Details
- Mode
Select the operating mode of the diagnostic system.
Select None/freeze when you have received the data and wish to freeze the presentation for a closer study of the results.
Select Element amplitude to start the test.
Select Element phase to start the test and observe the element phases.
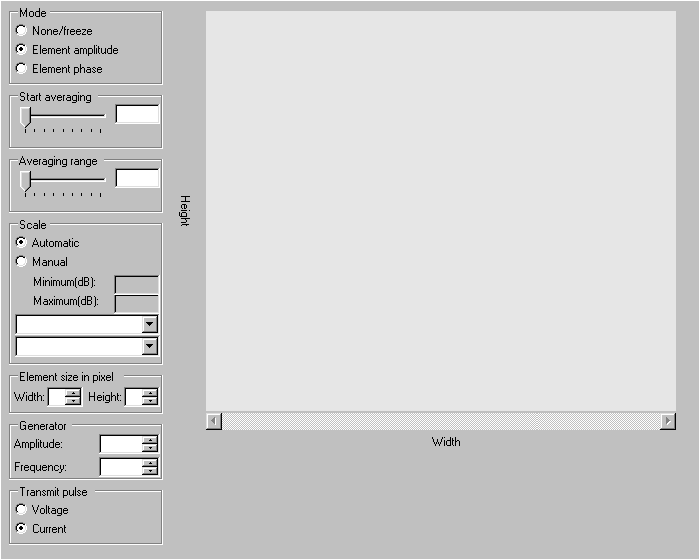
- Start Averaging
The test process collects data from all the channels, and calculates the average value. It may often be useful to start the data collection after the end of the transmit pulse. Use Start Averaging to select the first sample to be part of the data collection. Which samples to use, and how many, depends on the purpose of the test.
Use Averaging Range to select the number of samples to be included in the data collection.
- Averaging Range
Use Start Averaging to select the first sample to be part of the data collection. Use Averaging Range to select the number of samples to be included in the data collection.
- Scale
Choose the scale of the presentation.
- Element Size in Pixels
Use Element Size in Pixels to define the width and height of each individual element in the presentation (in pixels).
- Generator
In order to run this test, a built-in signal generator is used. You must specify the amplitude and frequency to be used by this generator. The signal generator creates a test signal inserted in parallel with the signal measured on the transducer.
- Transmit Pulse
Select Voltage or Current.
Voltage is always measured during reception. Voltage measurements during transmission are not reliable. By default, the system measures current during transmission.
- Text lines
Several text lines are provided under the graphic presentation.